Testing Bar Chart Readout of RGA
Monday 23 April 2012 - Filed under Uncategorized
On Friday April 20 codes to read out all atomic species 1-100 on the Spectra Vacscan RGA was tested. This mode is distinguished from the User Data mode which makes on 6 user selected atomic species available. A notable difference between the two modes is that the 6 species mode can be read out very rapidly ( typically with a min of 15 seconds per readout cycle) while the Bar Chart mode can take up to several minutes at the highest Gain setting.
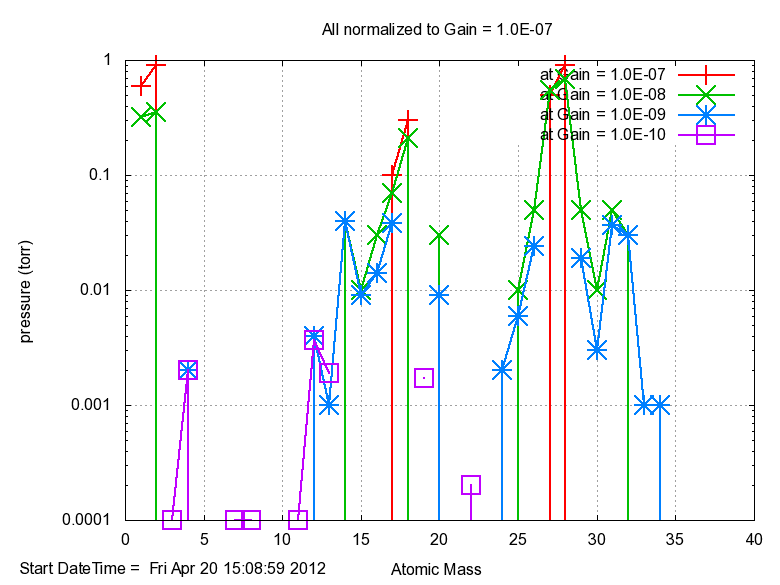
The Vacscan in use on the Chalice can read atomic species A=1-100. A particular annoyance is that when the gain setting is high enough to read low occurrence species, then the high occurrence species are returned as <<< and values are returned to a precision of only 2 decimal places. Thus to get a reasonable result, 4 scans a 4 different gains must be acquired and combined for plotting. A typical result is show below.
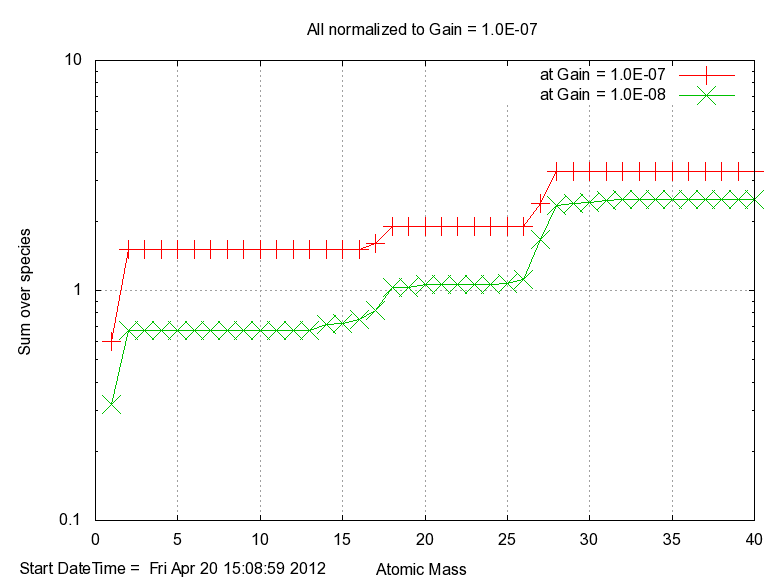
I note that runs at different gains do not produce identical results.! It is not clear to me that this represent the inherent precision of the device or some other systematic. The next plot show the result of summing up all the species.
The non-reproducibility with gain setting is very clear.
Bar Chart Summed Data User Chart Data
10^-8 10^-7 Total Presure (10^-7)
2.5 3.3 1.7
All normalized to 10^7
Ed May
2012-04-23 » edmay

